Energy dashboards transform raw consumption data into strategic insights that drive real business decisions. Most organisations struggle with scattered energy information across multiple systems and departments.
We at Spinifex Energy have seen companies reduce energy costs by 15-30% simply by implementing well-designed dashboard systems. The right visualisation tools turn complex energy patterns into clear action items for management teams.
Essential Components of Energy Dashboards
Effective energy dashboards require three non-negotiable components that separate successful implementations from expensive failures. Smart meters, sensors, and building management systems feed live consumption data directly into your dashboard, with updates every 15 minutes or less. Organisations with real-time monitoring achieve significant energy savings compared to those who rely on monthly utility bills, as utility bill data provides valuable high-level insights about annual and monthly energy consumption and costs.
Real-Time Consumption Monitoring
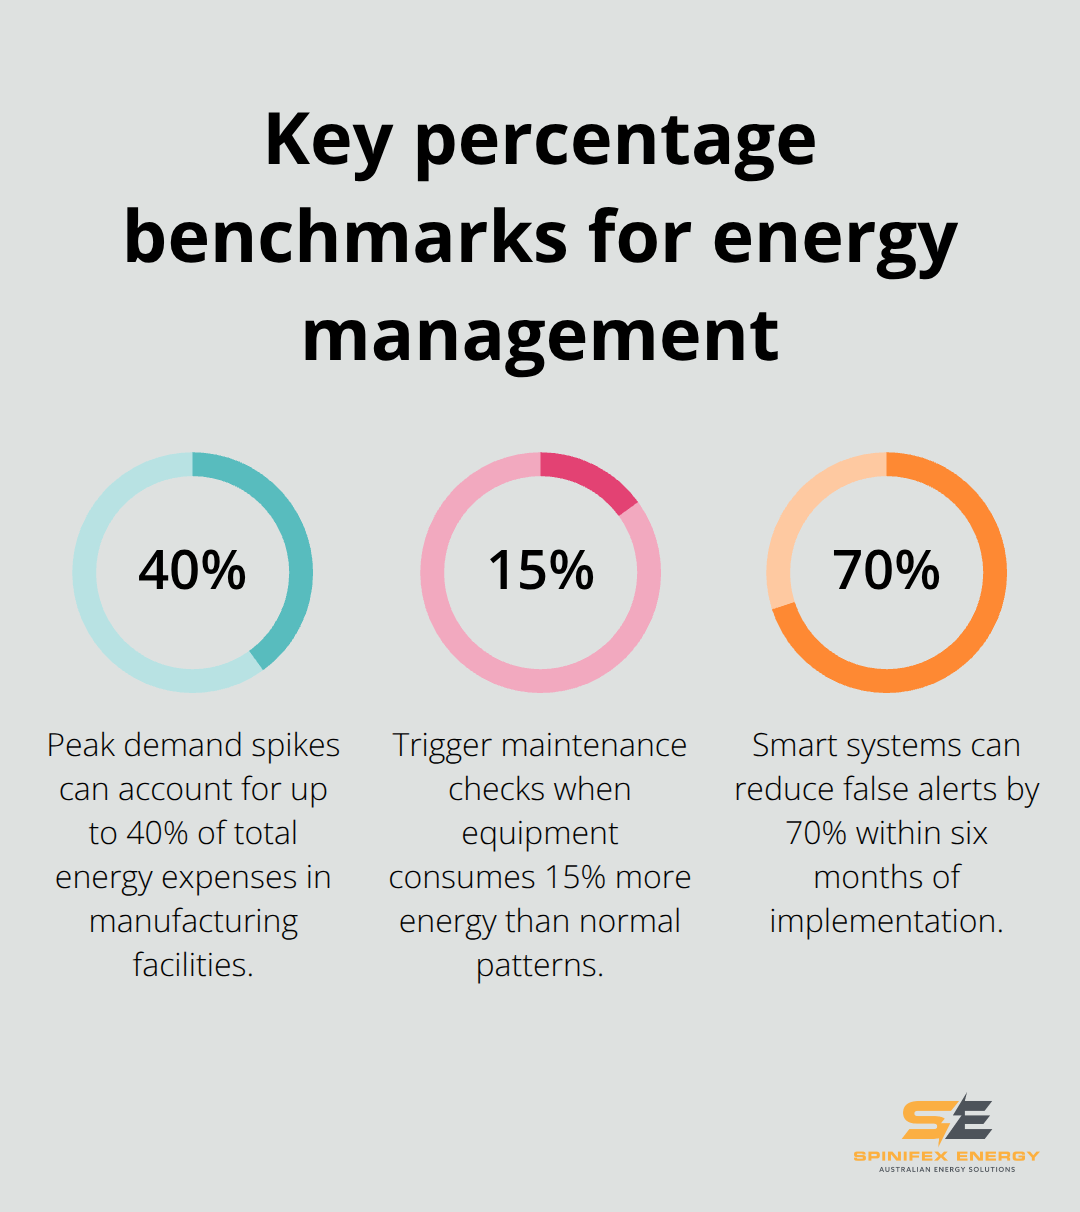
Your dashboard must display current kilowatt usage, demand charges, and power factor readings across all major equipment and building zones. Live data streams reveal equipment inefficiencies the moment they occur, not weeks later when utility bills arrive. Peak demand spikes cost manufacturing facilities up to 40% of their total energy expenses, yet most systems fail to alert managers when consumption enters expensive rate tiers.
Integrated Cost Analysis
Connect your utility rate structures directly to consumption patterns so managers spot when equipment pushes demand into higher cost brackets. Track monthly budget performance against actual spending and calculate the true cost per production unit or square foot. This financial transparency drives immediate behavioural changes across operations teams (particularly during peak hours when rates jump significantly).
Historical Performance Benchmarks
Compare current performance against the same period last year, similar facilities in your industry, and your own efficiency targets. Energy Use Intensity is expressed as energy per square foot per year, calculated by dividing total annual energy consumption by building area. Set up automated variance reports that flag when consumption exceeds normal patterns by more than 10% (triggering immediate investigation of equipment malfunctions or operational changes).
These dashboard foundations create the visibility needed for strategic energy management decisions. The next step involves designing interfaces that actually get used by busy decision-makers.
Best Practices for Dashboard Design and Implementation
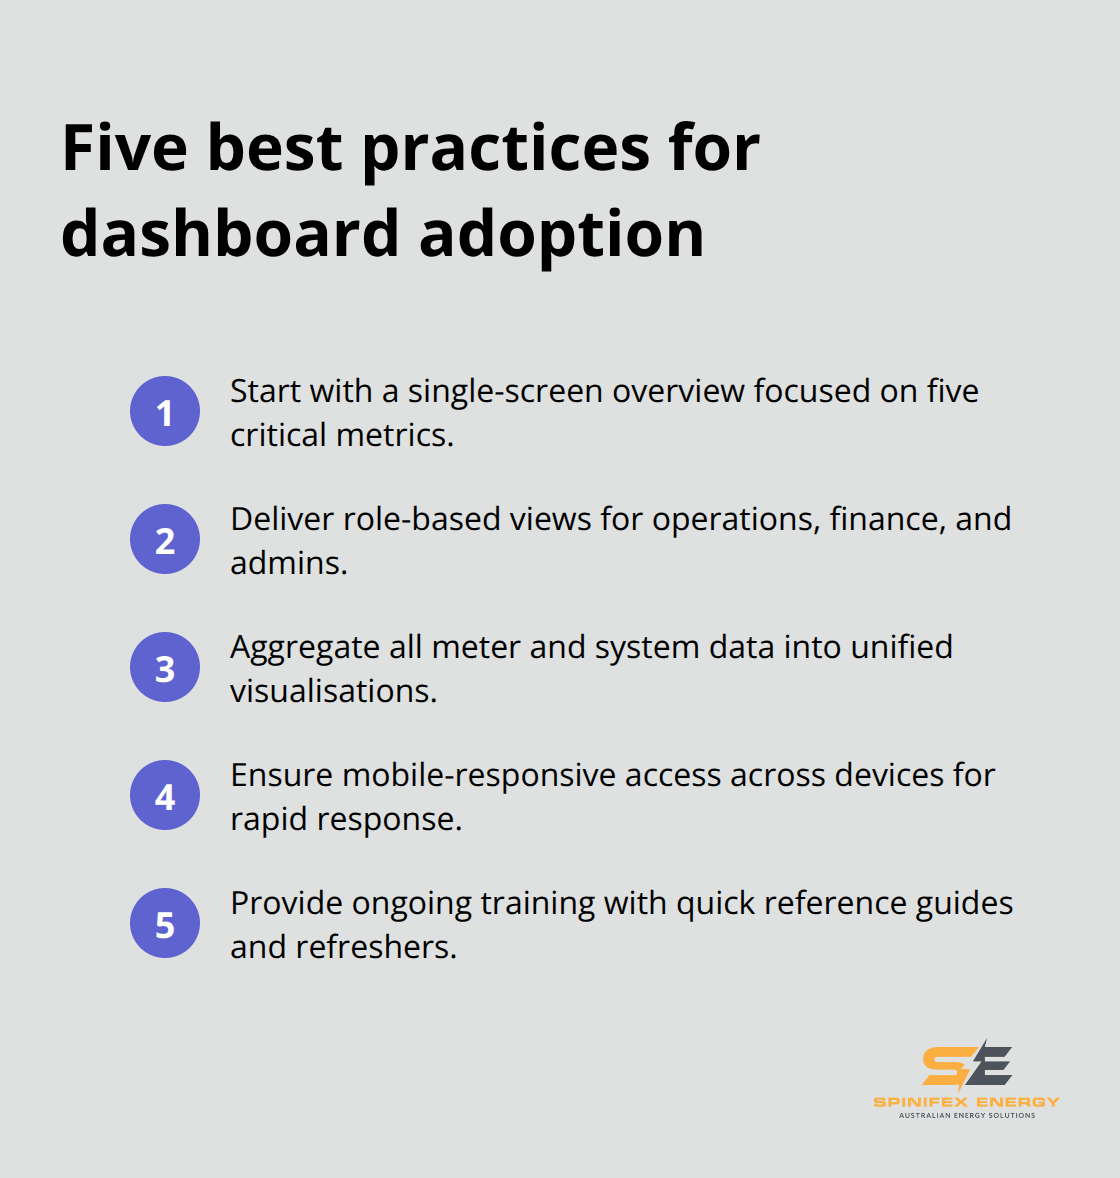
Dashboard adoption fails when interfaces prioritise data completeness over user experience. Start with a single-screen overview that shows only the five most critical metrics for each user role. Facility managers need different information than CFOs, yet most organisations deploy identical dashboards across all departments. Dashboard implementations often fail because users find interfaces too complex for daily operations.
Design for Specific User Roles
Operations teams require equipment-level consumption data with 15-minute intervals, while executives need monthly cost trends and benchmark comparisons. Create role-based views that filter information automatically based on login credentials. Manufacturing supervisors should see real-time machine efficiency alongside energy consumption per production unit. Financial managers need utility bill reconciliation features that compare projected costs against actual expenses. Administrative staff require simple alerts when consumption exceeds preset thresholds by 10% or more.
Integrate All Energy Data Sources
Modern facilities generate energy data through smart meters, HVAC controllers, lighting systems, and production equipment. Your dashboard must aggregate information from these disparate sources into unified visualisations. ELT data pipelines process information faster than traditional ETL methods and deliver updates within minutes rather than hours. Cloud-based integration platforms handle the technical complexity while they maintain data accuracy across multiple vendor systems.
Enable Mobile Access for Real Decisions
Energy managers make critical decisions outside office hours when equipment malfunctions or demand spikes occur. Mobile-responsive dashboards enable immediate responses to automated alerts during weekend production runs or after-hours maintenance periods. Touch-optimised interfaces simplify navigation on smartphones while they preserve essential functionality. Cross-platform compatibility means the same dashboard works seamlessly across Windows desktops, iPads, and Android devices without separate mobile applications required. Responsive design ensures accessibility across various devices from desktops to smartphones.
Train Teams for Maximum Adoption
Staff training determines whether your dashboard investment delivers results or collects digital dust. Schedule hands-on sessions that show each department how to interpret their specific metrics and respond to alerts. Create quick reference guides that explain what normal consumption patterns look like versus concerning spikes. Regular training updates help teams adapt when you add new features or data sources to the system.
These implementation practices create dashboards that teams actually use for daily decisions. The real value emerges when organisations transform this visibility into strategic energy management actions.
How Do You Transform Dashboard Data Into Strategic Energy Decisions
Dashboard data becomes valuable when organisations use specific consumption patterns to drive immediate operational changes. Peak demand analysis reveals that most commercial facilities experience their highest energy costs during 2-4 hour windows each day, typically between 2 PM and 6 PM when HVAC systems work hardest and production equipment runs simultaneously.
Peak Demand Pattern Analysis
Manufacturing plants that track 15-minute interval data can shift non-critical operations outside these expensive periods, which reduces demand charges significantly. Set demand targets 10% below your historical peak and configure automated load shedding when consumption approaches these thresholds. This proactive approach prevents costly demand spikes that can increase monthly bills by thousands of dollars within minutes.
Strategic KPI Development That Drives Action
Energy efficiency targets must connect directly to business operations rather than abstract percentage improvements. Calculate energy cost per production unit, per square foot, or per employee depending on your industry. Retail facilities should target 15-20 kWh per square foot annually, while manufacturing operations typically aim for energy costs below 3% of total production expenses.
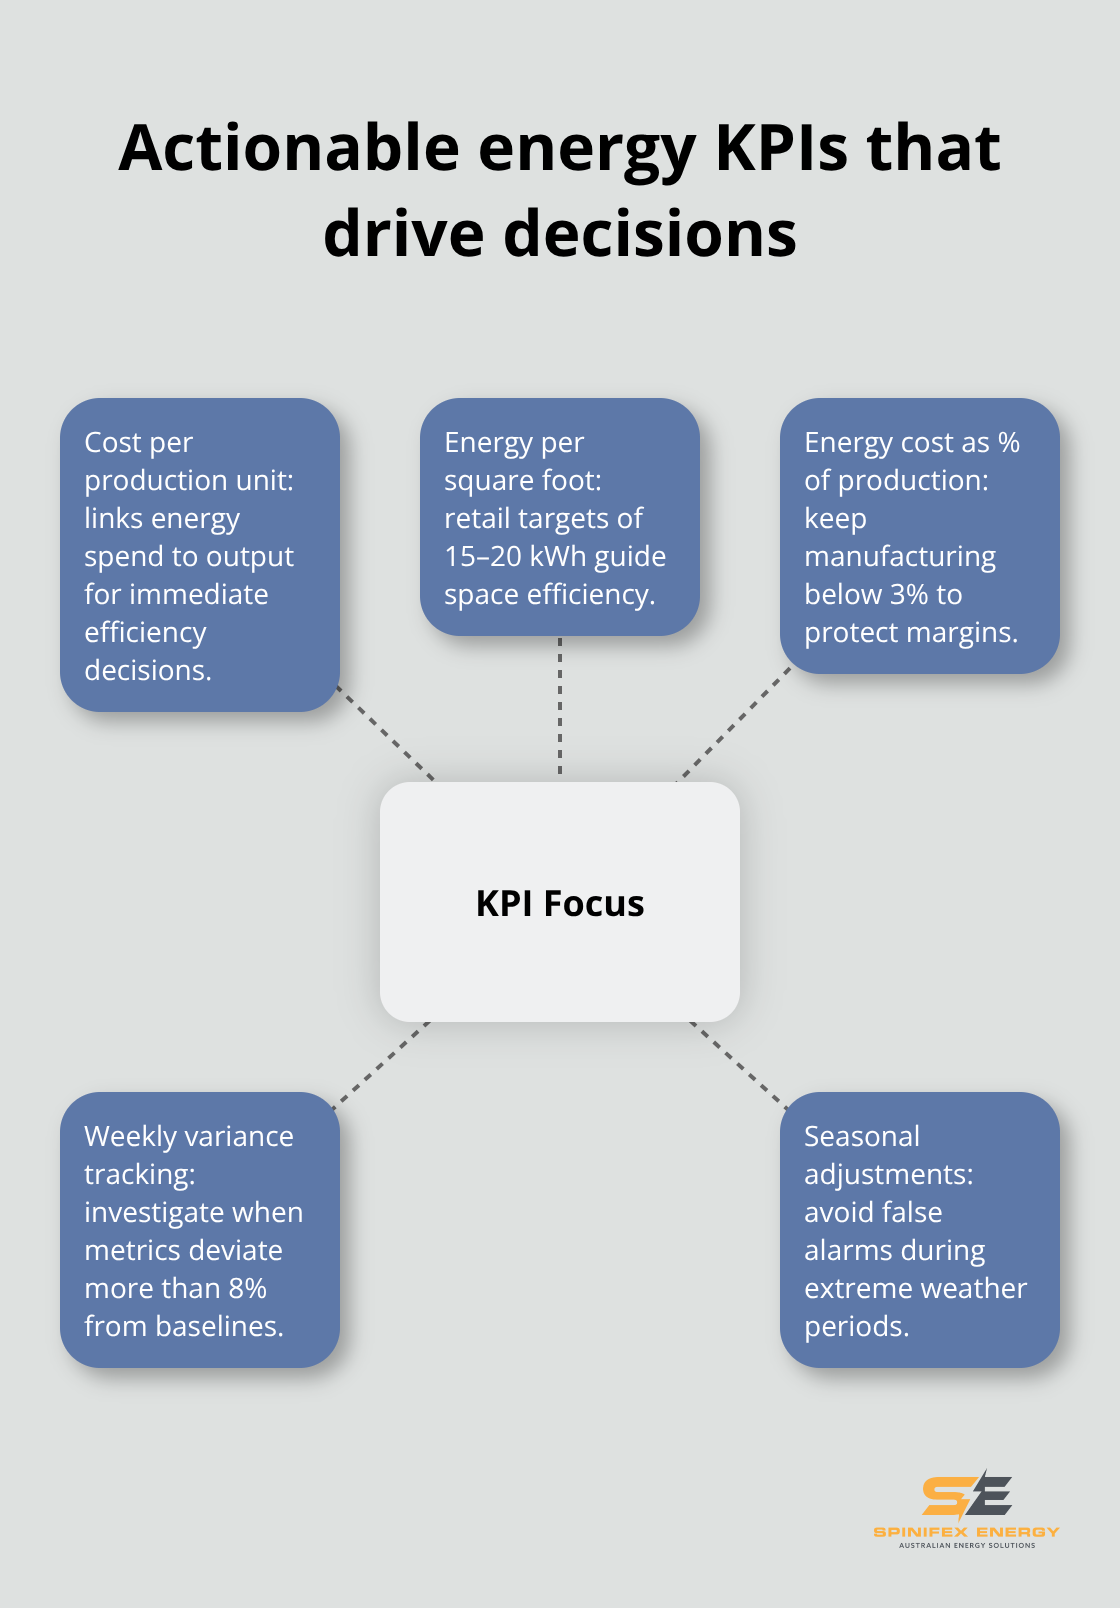
Track these metrics weekly and investigate immediately when performance deviates more than 8% from established baselines. Seasonal adjustments prevent false alarms during extreme weather periods when HVAC loads naturally increase (particularly during summer cooling seasons).
Automated Intelligence for Proactive Energy Management
Machine learning algorithms analyse historical consumption data to predict equipment failures before traditional maintenance schedules detect problems. Configure alerts when individual equipment pieces consume 15% more energy than normal operating patterns, which indicates bearing wear, filter blockages, or calibration drift.
Weekend and holiday consumption should drop 40-60% in office buildings, while continuous process facilities maintain steady baseline loads. Automated reports compare actual performance against weather-normalised baselines, which eliminates seasonal variations that mask true efficiency improvements. Smart systems learn your facility’s unique patterns and reduce false alerts by 70% within six months of implementation (based on industry performance data).
Final Thoughts
Well-designed energy dashboards deliver measurable financial returns within months of implementation. Organisations typically achieve 15-30% cost reductions when they identify inefficient equipment and optimise peak demand periods. Real-time visibility transforms reactive maintenance into proactive management, which prevents expensive equipment failures before they impact operations.
Success depends on three critical factors: role-specific interface design, comprehensive data integration, and ongoing staff training. Energy dashboards that display too much information overwhelm users, while systems that lack mobile access limit response capabilities during critical periods. Organisations must connect consumption data directly to business metrics rather than abstract efficiency percentages.
The next step involves partnering with experienced energy consultants who understand both dashboard technology and strategic energy procurement. We at Spinifex Energy help clients maximise their energy savings through comprehensive energy management solutions that combine advanced analytics with proactive procurement strategies. Energy dashboards provide the foundation, but comprehensive energy management requires expertise in commercial solar systems, battery storage solutions, and utility rate optimisation (which maximises long-term savings across all energy categories).